Les statistiques sur les jeux mobiles datant d'il y a quelques années ne sont plus d'actualité. Pourtant, de nombreuses sources reprennent sans cesse les mêmes chiffres en se contentant d'y ajouter la mention « 2026 ».
Si cela vous agace au plus haut point, vous n'êtes pas le seul. Dans le secteur des jeux mobiles, des informations datant de deux ou trois ans sont déjà dépassées.
Vous n'avez plus besoin de passer des heures à chercher et à vous décourager : cet article rassemble les statistiques les plus pertinentes et les plus récentes sur les jeux mobiles, ainsi que les tendances du secteur du jeu vidéo pour 2026 et au-delà.
Allons-y.
Statistiques sur le marché des jeux sur mobile
Le marché mondial des jeux mobiles a enregistré une baisse du nombre de téléchargements, mais une hausse de 1,3 % de son chiffre d'affaires.
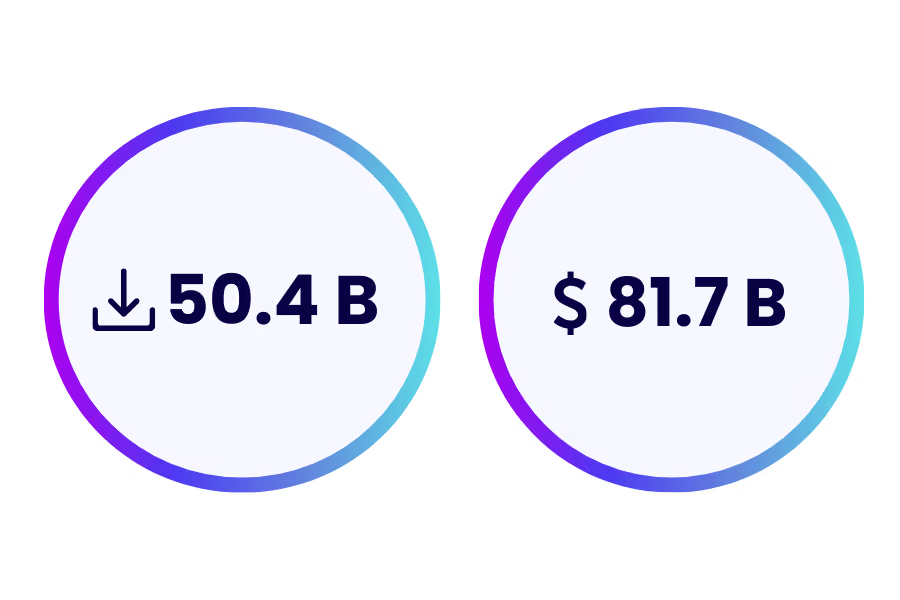
Téléchargements mondiaux de jeux mobiles et dépenses des consommateurs en 2025. Source des données : Sensor Tower
En 2025, on a dénombré 50,4 milliards de téléchargements de jeux mobiles, soit une baisse de 7,2 % par rapport à 2024 (Sensor Tower*).
Les dépenses mondiales des consommateurs sur mobile en 2025 se sont élevées à 81,7 milliards de dollars, soit une hausse de +1,3 % par rapport à 2024 (Sensor Tower*).
Le nombre total d'heures consacrées au jeu s'est élevé à 444 milliards, soit une hausse de 0,9 % par rapport à 2024. (Sensor Tower).
Le secteur du jeu vidéo a enregistré un chiffre d'affaires total de 188,8 milliards de dollars, soit une hausse de 3,4 % par rapport à 2024. (Newzoo)
Le jeu sur mobile reste le secteur le plus lucratif du jeu vidéo, avec un chiffre d'affaires annuel d' environ 103 milliards de dollars (55 % du chiffre d'affaires du marché). Le jeu sur console arrive en deuxième position, avec 45,9 milliards de dollars (24 % du chiffre d'affaires du marché), tandis que le jeu sur PC occupe la dernière place, avec 39,9 milliards de dollars (21 % du chiffre d'affaires du marché). (Newzoo)
*Ces données proviennent de rapport « State of Mobile 2025 » de Sensor Tower de Sensor Tower. Cependant, ce rapport ne comprend pas les données relatives à Android en Chine ; ce chiffre pourrait donc être sous-estimé.
Statistiques sur les jeux mobiles par pays
Quel est le plus grand marché pour les jeux mobiles ? Quels sont les marchés qui dominent en termes de chiffre d'affaires, et ceux qui dominent en termes de téléchargements ?
Jetons un coup d'œil aux derniers classements du marché des jeux mobiles établis par Sensor Tower.
Les principaux marchés en termes de chiffre d'affaires sont restés inchangés, tandis que l'Inde et l'Indonésie sont les pays qui enregistrent le plus grand nombre de téléchargements.
Principaux marchés des jeux mobiles en termes de téléchargements
*Ces données sont tirées du rapport « State of Mobile 2026 » de Sensor Tower. Toutefois, ce rapport ne comprend pas les données relatives à Android en Chine ; ce chiffre pourrait donc être sous-estimé.
Statistiques sur les genres de jeux mobiles
Ce sont les jeux de stratégie qui ont enregistré la plus forte progression en termes de chiffre d'affaires et de téléchargements.
Le chiffre d'affaires issu des achats intégrés s'est élevé à 44,7 milliards de dollars pour les jeux « midcore », à 32,7 milliards de dollars pour les jeux « casual » et à 4,2 milliards de dollars pour les jeux « hybridcasual ».
Le nombre de téléchargements s'est élevé à 22 milliards pour les jeux « hypercasual », à 14,3 milliards pour les jeux « casual », à 6 milliards pour les jeux « hybridcasual » et à 5,4 milliards pour les jeux « midcore ».
Le nombre total d'heures consacrées au jeu s'est élevé à 225,6 milliards pour les jeux « midcore », à 124,8 milliards pour les jeux « casual », à 66,2 milliards pour les jeux « hypercasual » et à 27,5 milliards pour les jeux « hybridcasual ».
Les genres de jeux mobiles ayant enregistré la plus forte variation en glissement annuel en termes de téléchargements sont la stratégie, la simulation et les jeux d'arcade, suivis par les jeux de tir, les jeux de rôle et les jeux de casino.
Selon Sensor Tower, les genres de jeux mobiles les plus populaires en termes de dépenses des consommateurs étaient les jeux de stratégie, les jeux de réflexion et les jeux de tir.
Les sous-genres de jeux mobiles les plus populaires en termes de temps passé sont les jeux de simulation, les jeux de réflexion et les jeux de stratégie.
*Les données présentées dans cette section sont tirées du rapport « The State of Mobile 2026 » de Sensor Tower.
Combien y a-t-il de joueurs sur mobile ? Pourquoi les gens jouent-ils à des jeux sur mobile ?
Voici les dernières statistiques sur les jeux mobiles qui apportent des réponses à ces questions.
Nombre de joueurs sur mobile et données démographiques
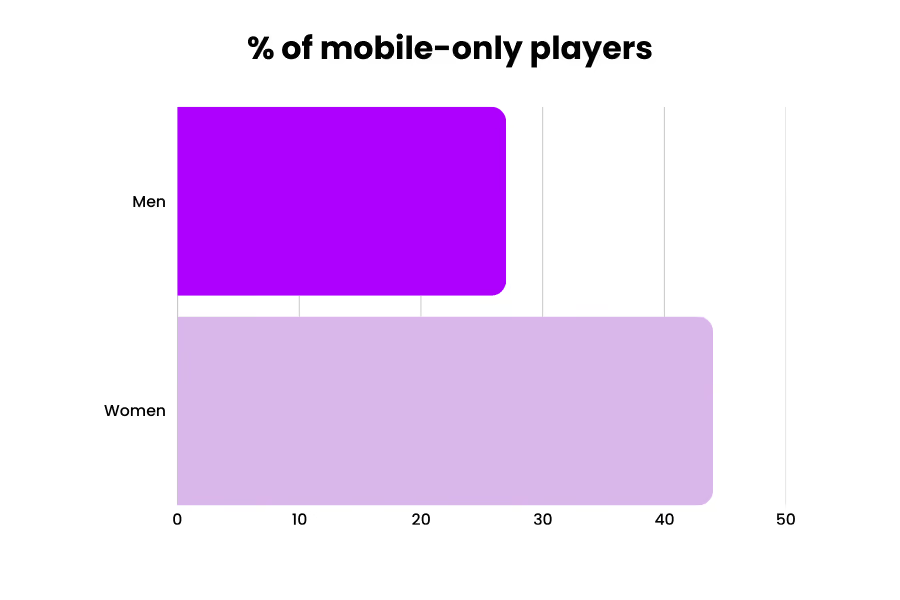
Les femmes sont plus susceptibles de jouer exclusivement sur mobile.
Répartition en pourcentage des joueurs sur mobile par sexe. Source des données : Statista
En 2025, le nombre estimé de joueurs sur mobile s'élevait à 3 milliards, tandis que le nombre total de joueurs atteignait 3,6 milliards. Cela représente une hausse de 4,5 % par rapport à 2024. (Newzoo)
Toutes plateformes confondues, les jeux sur mobile rassemblent le plus grand pourcentage de joueurs (83 %), tandis que les jeux sur PC et sur console sont moins répandus (respectivement 26 % et 18 % des joueurs). (Newzoo)
Si l'on considère l'ensemble des joueurs (sur mobile, PC et consoles), on constate une légère majorité d'hommes : 55 % d'hommes contre 45 % de femmes. Cependant, 44 % des joueuses jouent exclusivement sur mobile, contre 27 % des joueurs.
La tranche d'âge la plus représentée parmi les joueurs sur mobile est celle des 18-34 ans, 38 % de cette population jouant activement à des jeux sur mobile (Business of Apps)
Statistiques sur les joueurs mobiles par génération
Ce sont les jeunes générations qui sont les plus engagées et qui redéfinissent les modes de consommation des jeux vidéo.
Les deux générations qui comptent la plus forte proportion de joueurs sur mobile sont la génération Alpha (94 %) et la génération Z (92 %), mais elles sont talonnées de près par la génération Y (88 %) et la génération X (72 %) (Newzoo).
79 % des joueurs interagissent avec du contenu généré par les utilisateurs et ont déjà joué à un jeu dont le contenu a été créé par les utilisateurs (Xsolla).
L'aventure est le genre de jeu préféré de la génération Alpha (54 %), de la génération Z (45 %) et des milléniaux (44 %), tandis que la génération X (46 %) et les baby-boomers (50 %) préfèrent les jeux de réflexion. (Newzoo)
Les jeunes joueurs sont attirés par les aspects sociauxcompétitifs (71 %) et coopératifs (68 %) du jeu vidéo. (Newzoo)
* Légende des générations : Génération Alpha (début des années 2010 ou après), Génération Z (1995 à 2009), Génération Y (1981 à 1994), Génération X (1965 à 1980)
Échapper au stress ou à des tâches désagréables (50 %)
Acquérir de nouvelles compétences ou se lancer des défis (45 %)
Pratiquer des activités créatives ou des jeux de rôle (21 %)
Rivaliser avec les autres (18 %)
Rencontrer d'autres personnes (14 %)
Relations sociales
Les êtres humains sont des êtres sociaux, et les joueurs sur mobile ne font pas exception.
Dans une enquête menée par Statista, les joueurs ont déclaré que :
Ils s'accordent à dire que les jeux vidéo permettent de se faire de nouveaux amis (78 %).
Ils ont fait de nouvelles connaissances grâce aux jeux vidéo (49 %).
Les jeux vidéo leur permettent de rester en contact avec leur famille et leurs amis (49 %).
Ils ont rencontré un(e) bon(ne) ami(e), un(e) conjoint(e) ou un(e) partenaire grâce aux jeux vidéo (39 %)
Statistiques sur la fidélisation des joueurs de jeux mobiles
Examinons les taux moyens de fidélisation des jeux mobiles afin de comprendre comment les utilisateurs interagissent avec ces jeux et y restent fidèles, d’après les données d’AppFlyer.
Taux de fidélisation moyens des jeux mobiles
Sensor Tower a analysé les 25 jeux les plus populaires de chaque catégorie, et voici ce qu'ils ont constaté en matière de fidélisation :
Maintien en D1
Décontracté : 31,01 %
Hypercasual : 38,03 %
Hybride-décontracté : 40,11 %
Midcore : 41,98 %
Rétention D7
Décontracté : 15,20 %
Hypercasual : 13,25
Hybridcasual : 16,08 %
Midcore : 20,96 %
Rétention D30
Taux de chômage partiel : 7,48 %
Hypercasual : 4,63 %
Hybridcasual : 5,86 %
Midcore : 11,45 %
Dans l'ensemble, iOS affiche des taux de fidélisation plus élevés qu'Android.
Taux de fidélisation par genre
Les jeux d'association, les puzzles et les jeux de société occupent une place prépondérante tant en matière de rétention à court terme qu'à long terme.
Les genres de jeux mobilesqui affichent les taux de fidélisation les plus élevés dès le premier jour sont les jeux de stratégie (32,65 %), les jeux de réflexion (31,85 %), les jeux de société (31,30 %), les jeux de rôle (30,54 %) et les jeux de simulation (30,10 %) (Business of Apps).
Les genres présentant les taux de rétention les plus élevés au 30e jour sont les jeux de combat (7,15 %), les jeux de société (5,51 %), les jeux de réflexion (5,35 %), les jeux de casino (4,10 %) et les jeux de rôle (3,48 %) (Business of Apps).
Jeu multiplateforme
Le jeu multi-appareils reste l'une des principales tendances du jeu mobile.
Près de 50 % des joueurs jouent sur plusieurs plateformes (Newzoo)
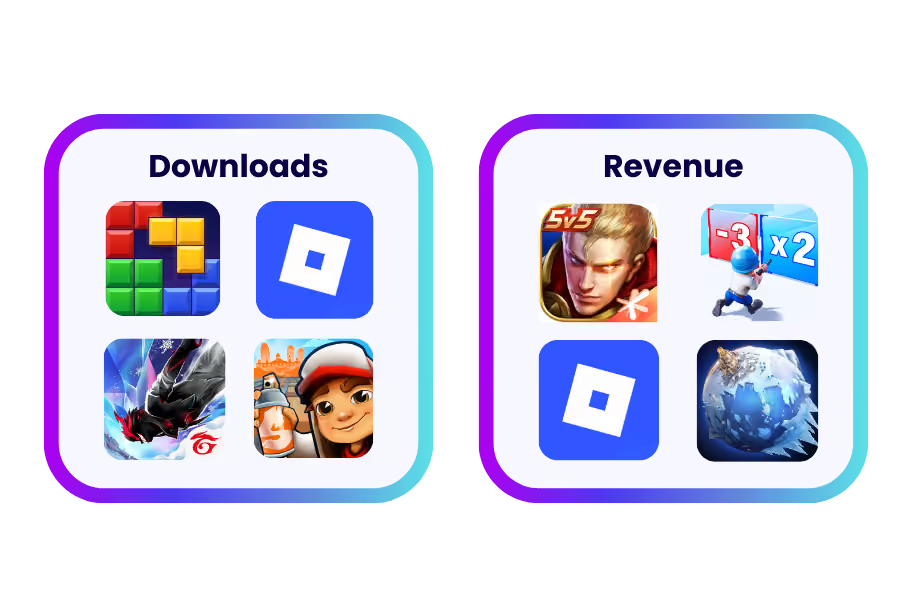
My Talking Tom 2 : Jeu d'animaux de compagnie, 122 289 746
Hole.io, 121.437.589
PUBG MOBILE, 115 494 642
Les meilleurs jeux mobiles en termes de chiffre d'affaires
« Honor of Kings » est le jeu qui génère le plus de recettes, avec un chiffre d'affaires de 1,7 milliard de dollars en 2025.
Voici les dix jeux mobiles ayant généré le plus de recettes en 2023, selon AppMagic.
Honor of Kings, 1 683 911 252 $
Last War : Survival, 1 573 337 948 $
Roblox, 1 450 146 387 dollars
Whiteout Survival, 1 401 542 915 $
Royal Match, 1 374 587 444 $
MONOPOLY GO !, 1 360 776 303 $
PUBG MOBILE, 1 123 292 746 $
Candy Crush Saga, 1 011 009 231 $
Pokémon TCG Pocket, 677 353 575 $
Coin Master, 650 648 450 $
Les principaux éditeurs de jeux mobiles
Les éditeurs chinois de jeux mobiles continuent de dominer les classements mondiaux en termes de chiffre d'affaires, mais de nouveaux acteurs ont également fait leur apparition.
D'après les données d'AppMagic, les éditeurs de jeux mobiles ayant généré le plus de recettes en 2025 étaient les suivants :
Tencent, Chine, 5 718 738 092 $
Century Games Pte. Ltd., Chine, 2 051 857 611 $
Scopely, Inc., États-Unis, 1 632 360 633 $
Dream Games, Turquie, 1 620 613 915 $
FUNFLY PTE. LTD., Singapour, 1 596 878 886 $
Roblox Corporation, États-Unis, 1 450 146 387 $
NetEase, Chine, 1 396 393 953 $
Playrix, Irlande, 1 393 119 121 $
King, Suède, 1 296 223 417 $
Supercell, Finlande, 1 124 772 950 $
Réflexions finales sur le jeu mobile en 2026
Ces statistiques sur les jeux mobiles reflètent les principales tendances du secteur.
Sur Mistplay, nous nous engageons à tenir nos lecteurs informés des dernières actualités, tendances et évolutions du secteur des jeux mobiles.
Nous mettrons cet article à jour tout au long de l'année 2026et y intégrerons régulièrement les nouvelles conclusions des prochains rapports sectoriels. Restez informé de toutes ces actualités en vous abonnant à notre newsletter dans la barre latérale ou en nous suivant sur LinkedIn.
Mettez la puissance du jeu incitatif au service de votre marque
.avif)